If you practice index investing and take a long-term approach, this workflow probably feels familiar:
At the end of every month, you log into your brokerage account, copy down the shares and market value of VT, VTI, or BND, and paste them into an Excel spreadsheet you’ve been maintaining for years. Excel is powerful, no doubt — but having to manually adjust formulas, double-check cell references, or simply trying to check your asset allocation quickly on your phone is… far from ideal.
There are asset tracking tools on the market (such as Wealthfolio), but many of them are designed as local desktop or mobile apps. That means switching devices or syncing data across platforms often takes extra effort. Others go in the opposite direction — overloaded with stock fundamentals, trading indicators, or crypto data — creating unnecessary noise for investors who just want to focus on asset allocation.
That’s the motivation behind Ascent Portfolio: a no-install, cloud-synced tool dedicated to tracking your investment journey, asset allocation, and rebalancing — nothing more, nothing less.
Why Ascent Portfolio?
Ascent Portfolio is built around a single idea:make long-term investing easier to stick with.
Here’s a quick comparison with common tracking methods:
| Feature | Ascent Portfolio | Excel / Google Sheets | Local Apps (e.g. Wealthfolio) |
|---|---|---|---|
| Usage | Web-based (no install) | Spreadsheet | App installation required |
| Cross-device sync | ✅ Automatic & real-time | ⚠️ Poor mobile experience | ⚠️ Often paid or manual |
| Rebalancing support | ✅ Built-in suggestions | ❌ Manual formulas | ❌ Mostly record-only |
| Learning curve | ⭐ Low | ⭐⭐⭐ High (formulas) | ⭐⭐ Medium |
Ascent Portfolio is built as a cloud-based SaaS. There’s no need to manage iCloud, Google Drive, or Dropbox syncing. Whether you’re on a Windows PC at work, a MacBook at home, or your phone during a commute — open the browser and your data is always up to date.
Feature Overview: Your Automated Investment Dashboard
Here’s how Ascent Portfolio helps you manage your assets day to day.
Markets & Assets
- US Market: Supports all stocks and ETFs listed on NYSE and NASDAQ (e.g. VT, VTI, BND, VOO).
- Taiwan Market: Supports stocks and ETFs listed on TWSE and TPEx (e.g. 0050, 006208).
- Cash Assets: Track idle cash positions and include them in your overall allocation.
Currency & FX
- Multi-currency transactions: Record trades in USD or TWD.
- Base currency switching: View total portfolio value in either USD or TWD.
- Automatic FX conversion: Exchange rates are fetched automatically — no manual calculations needed.
Dashboard
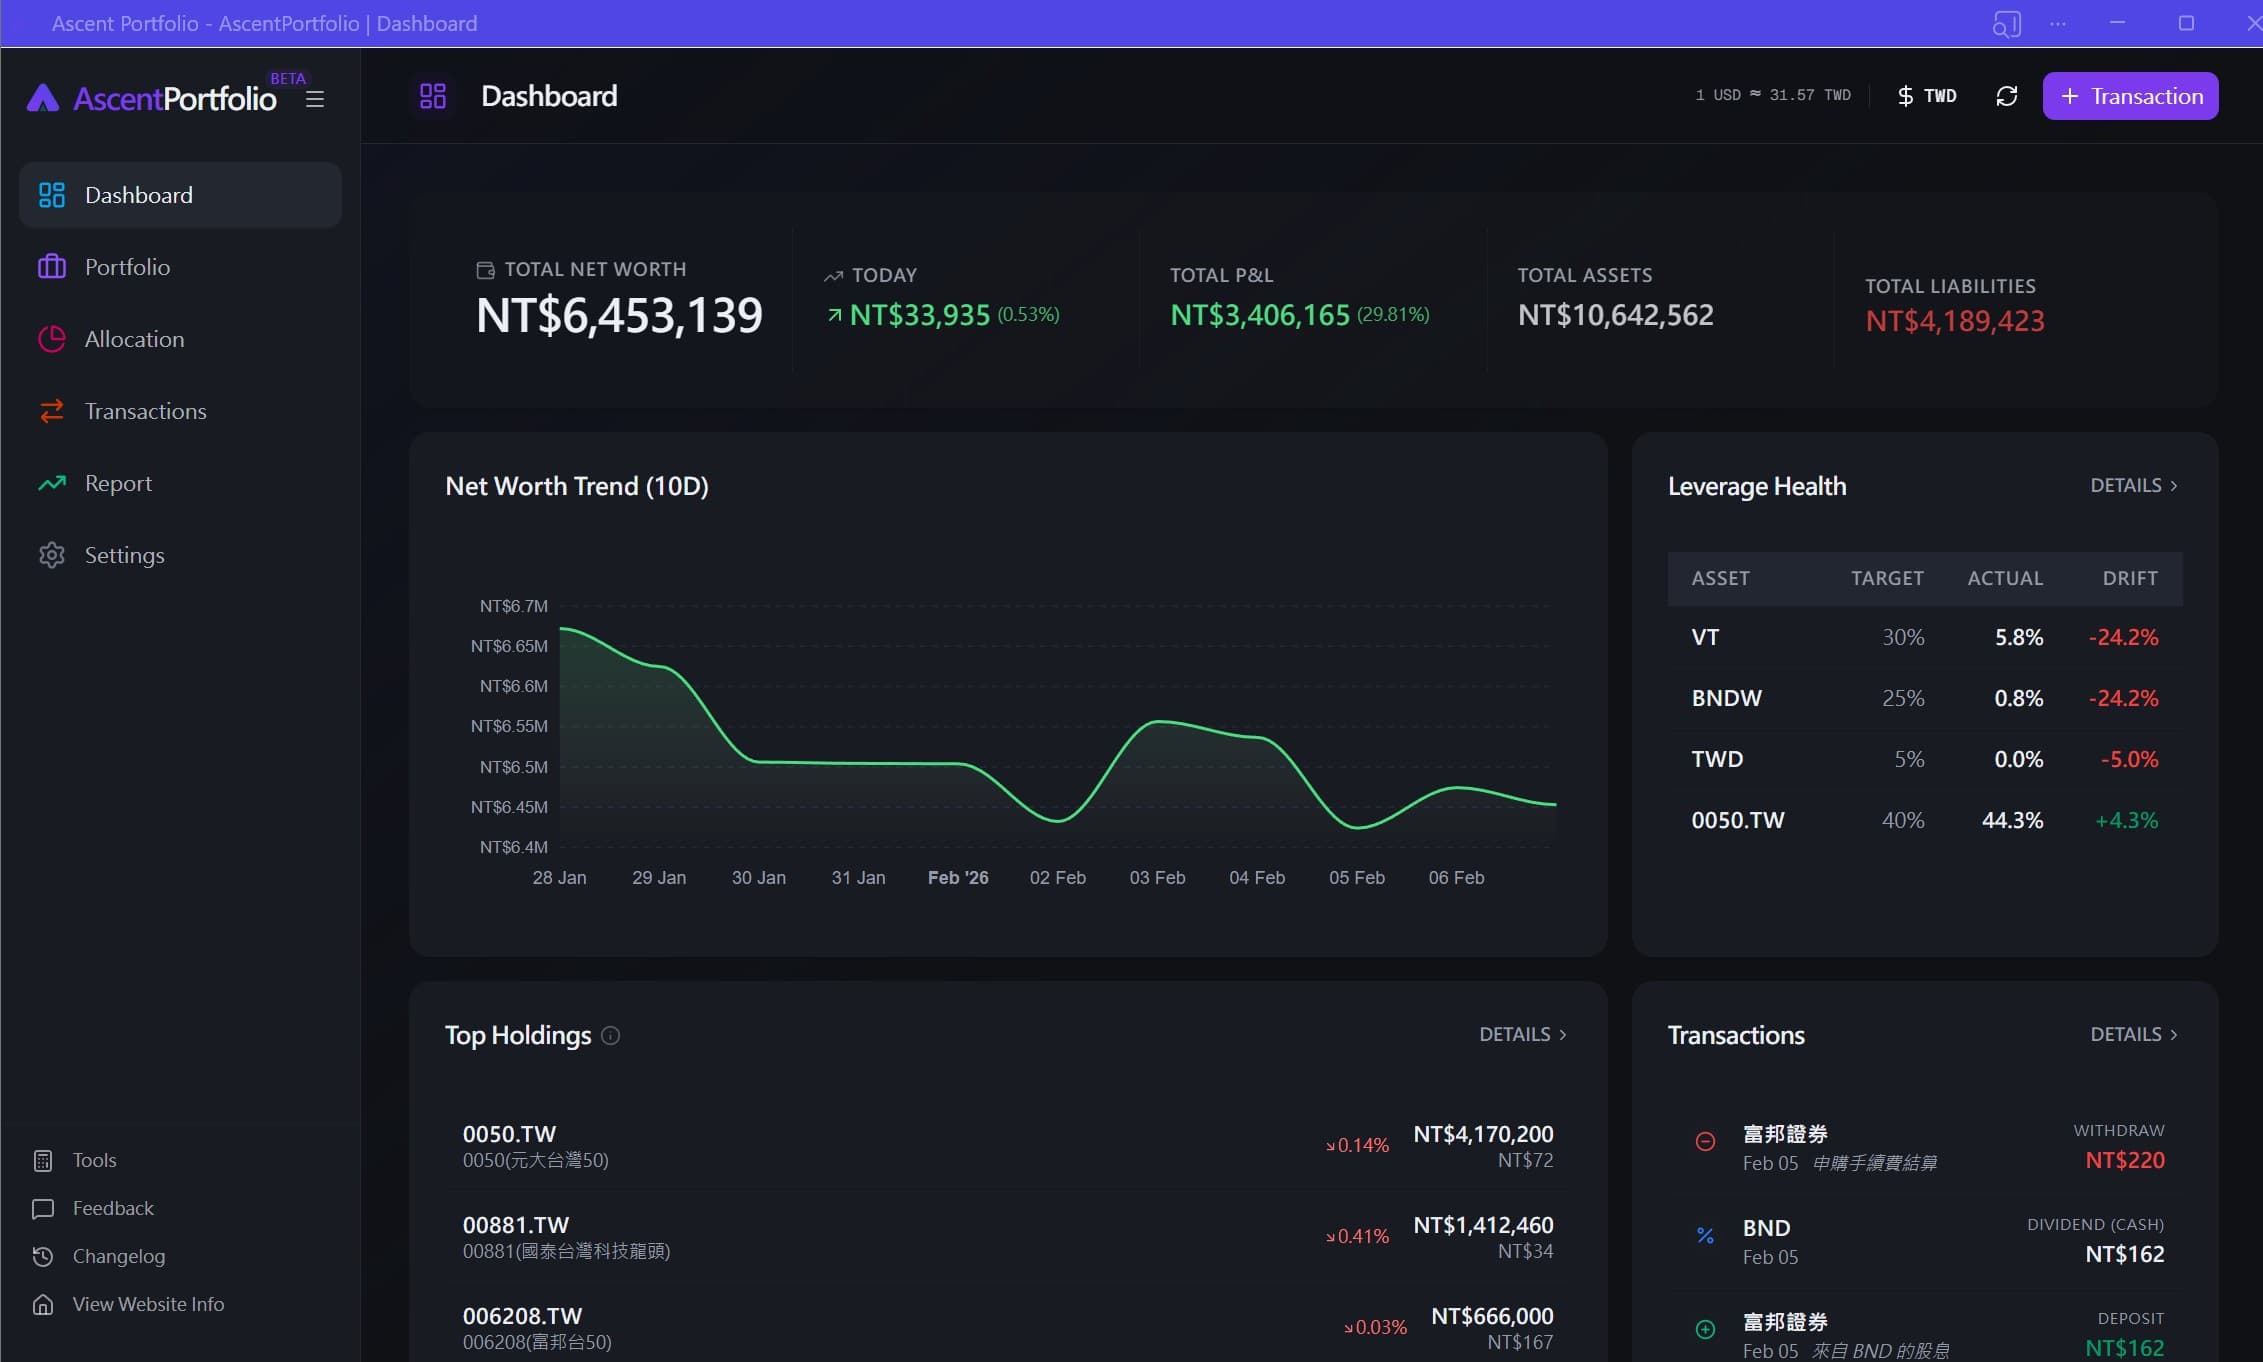
Desktop
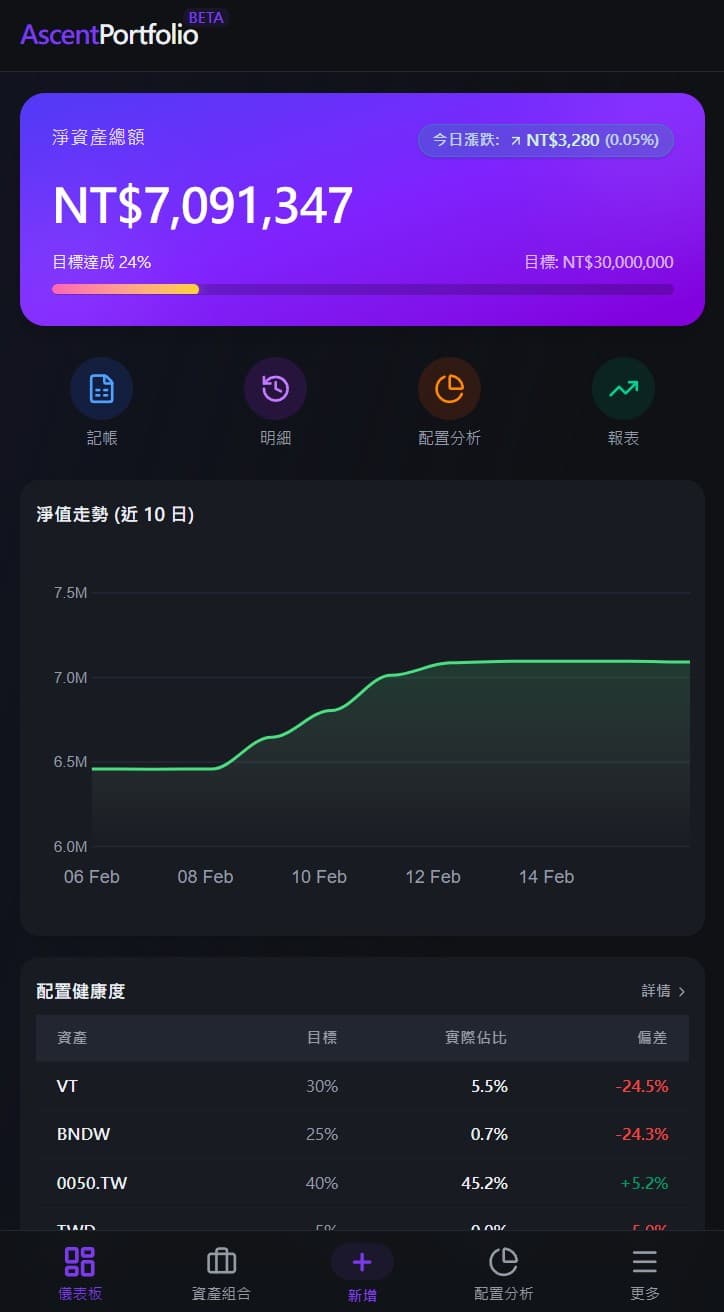
Mobile
- Total net worth: A clear view of your portfolio’s current value.
- Real-time P&L: Automatically updated daily profit/loss and total return.
- Market data integration: Live pricing for US and Taiwan stocks and ETFs.
Portfolio Management
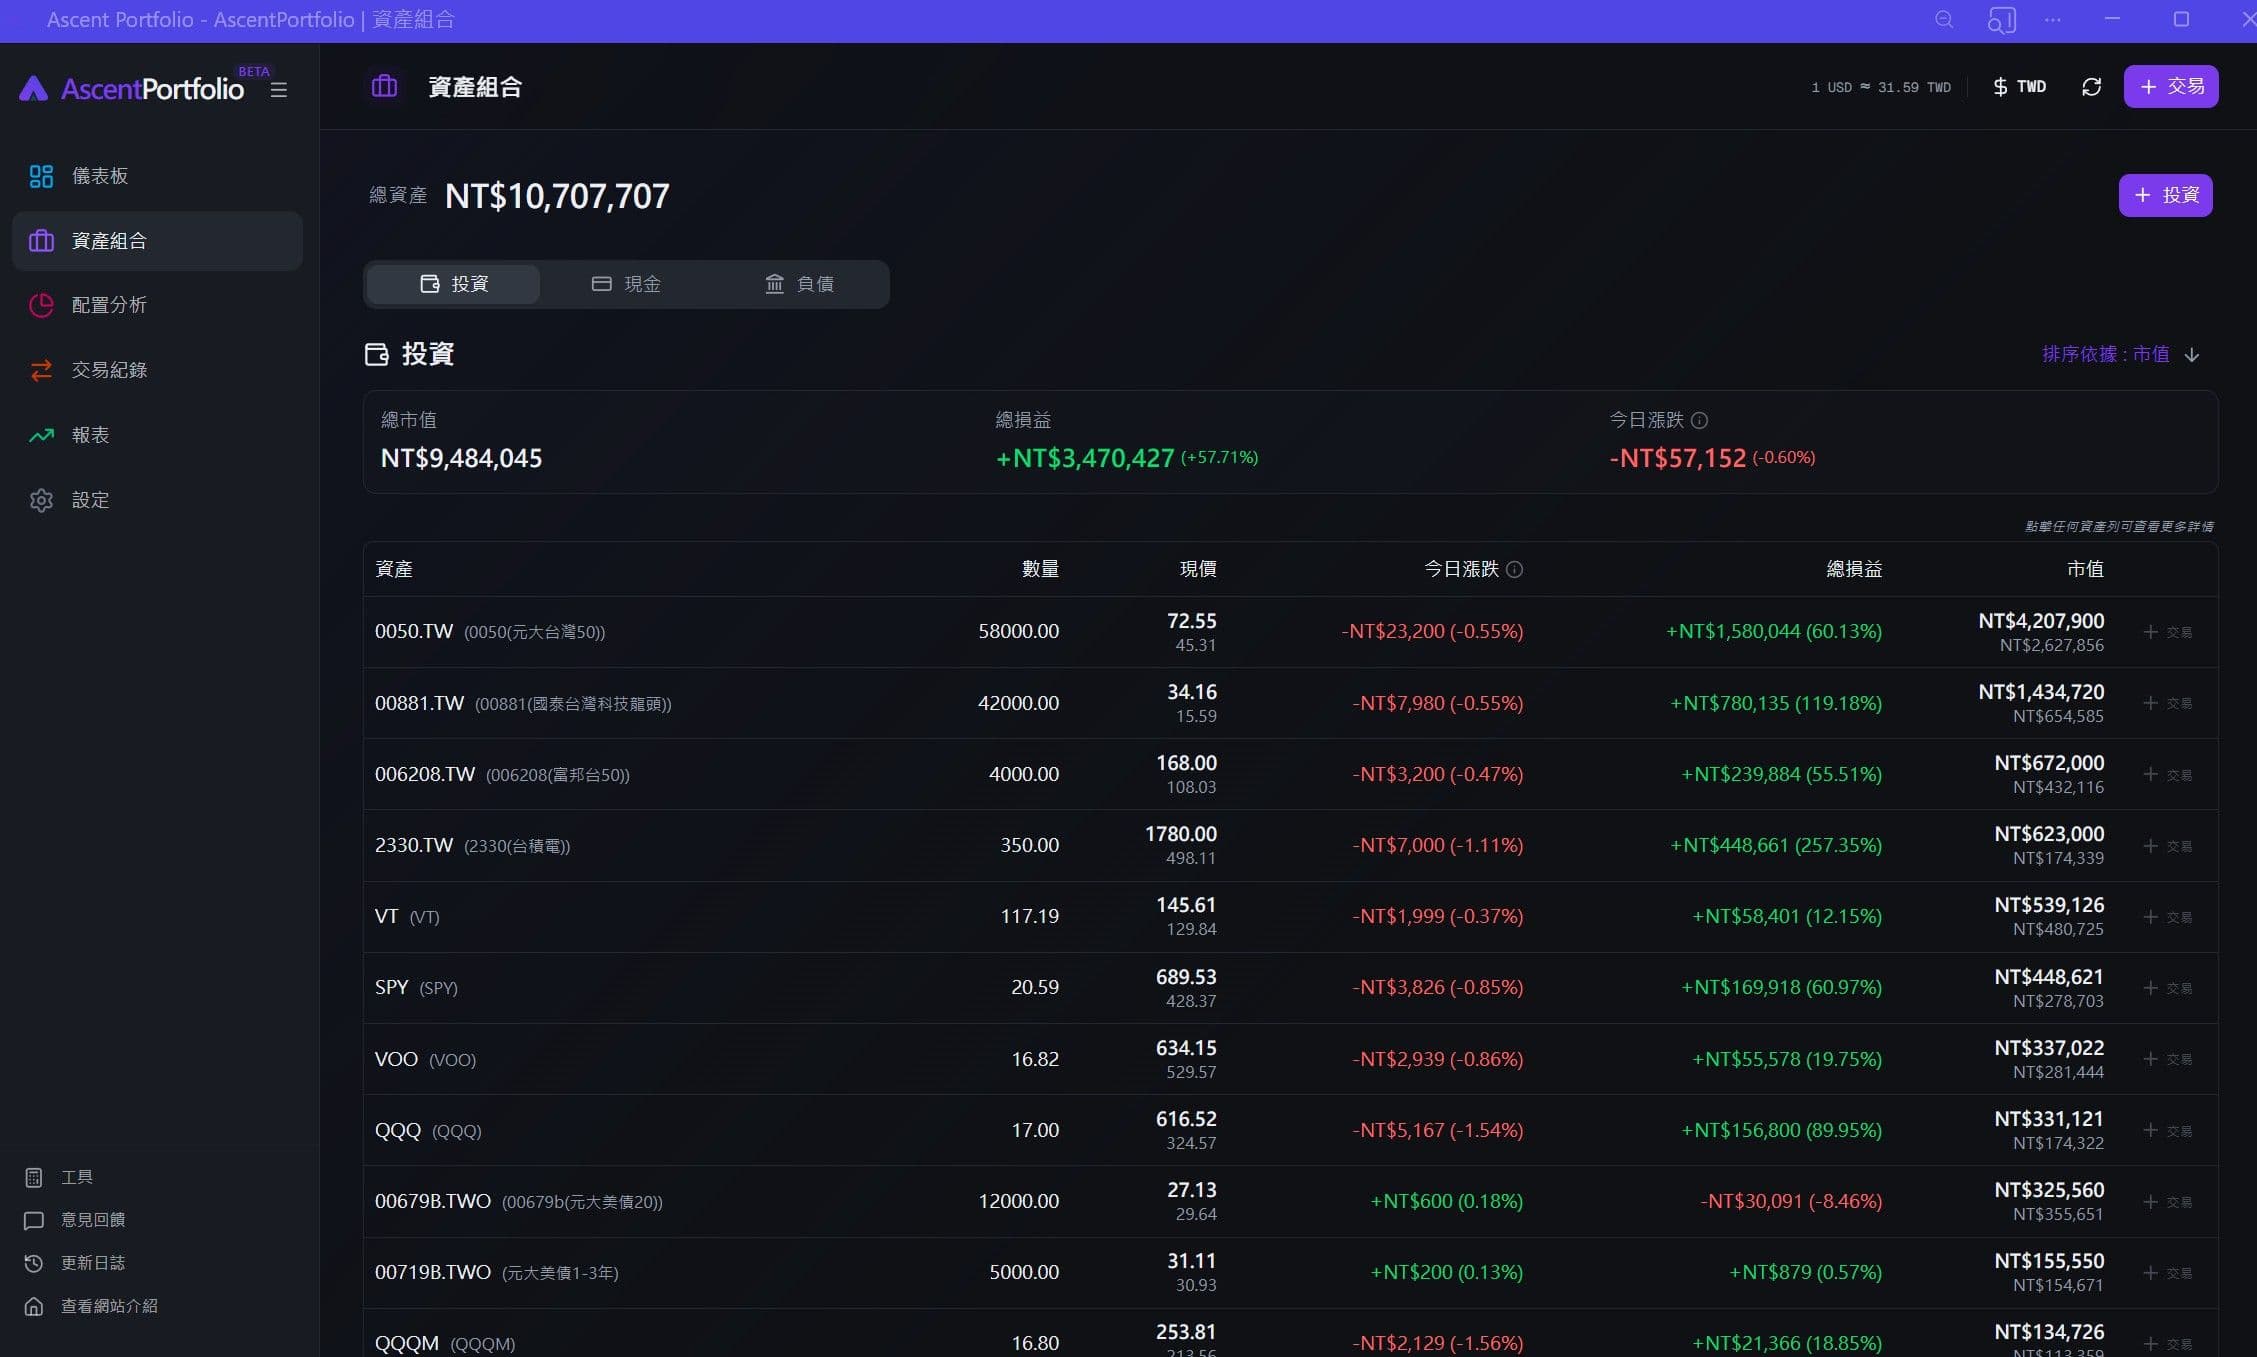
Desktop
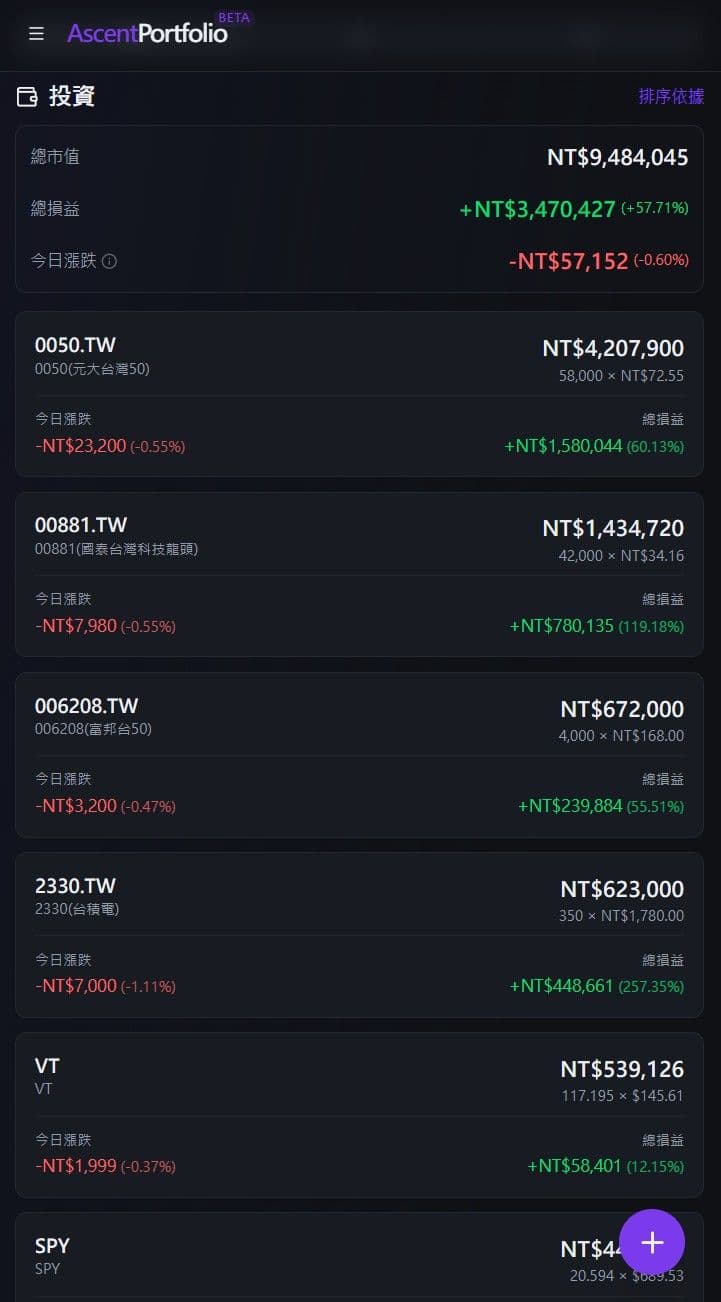
Mobile
- Transaction log: Record buy, sell, and cash dividend transactions.
- Average cost calculation: Automatically computes average cost and unrealized P&L.
- Multi-market support: Seamlessly track both US and Taiwan assets in one place.
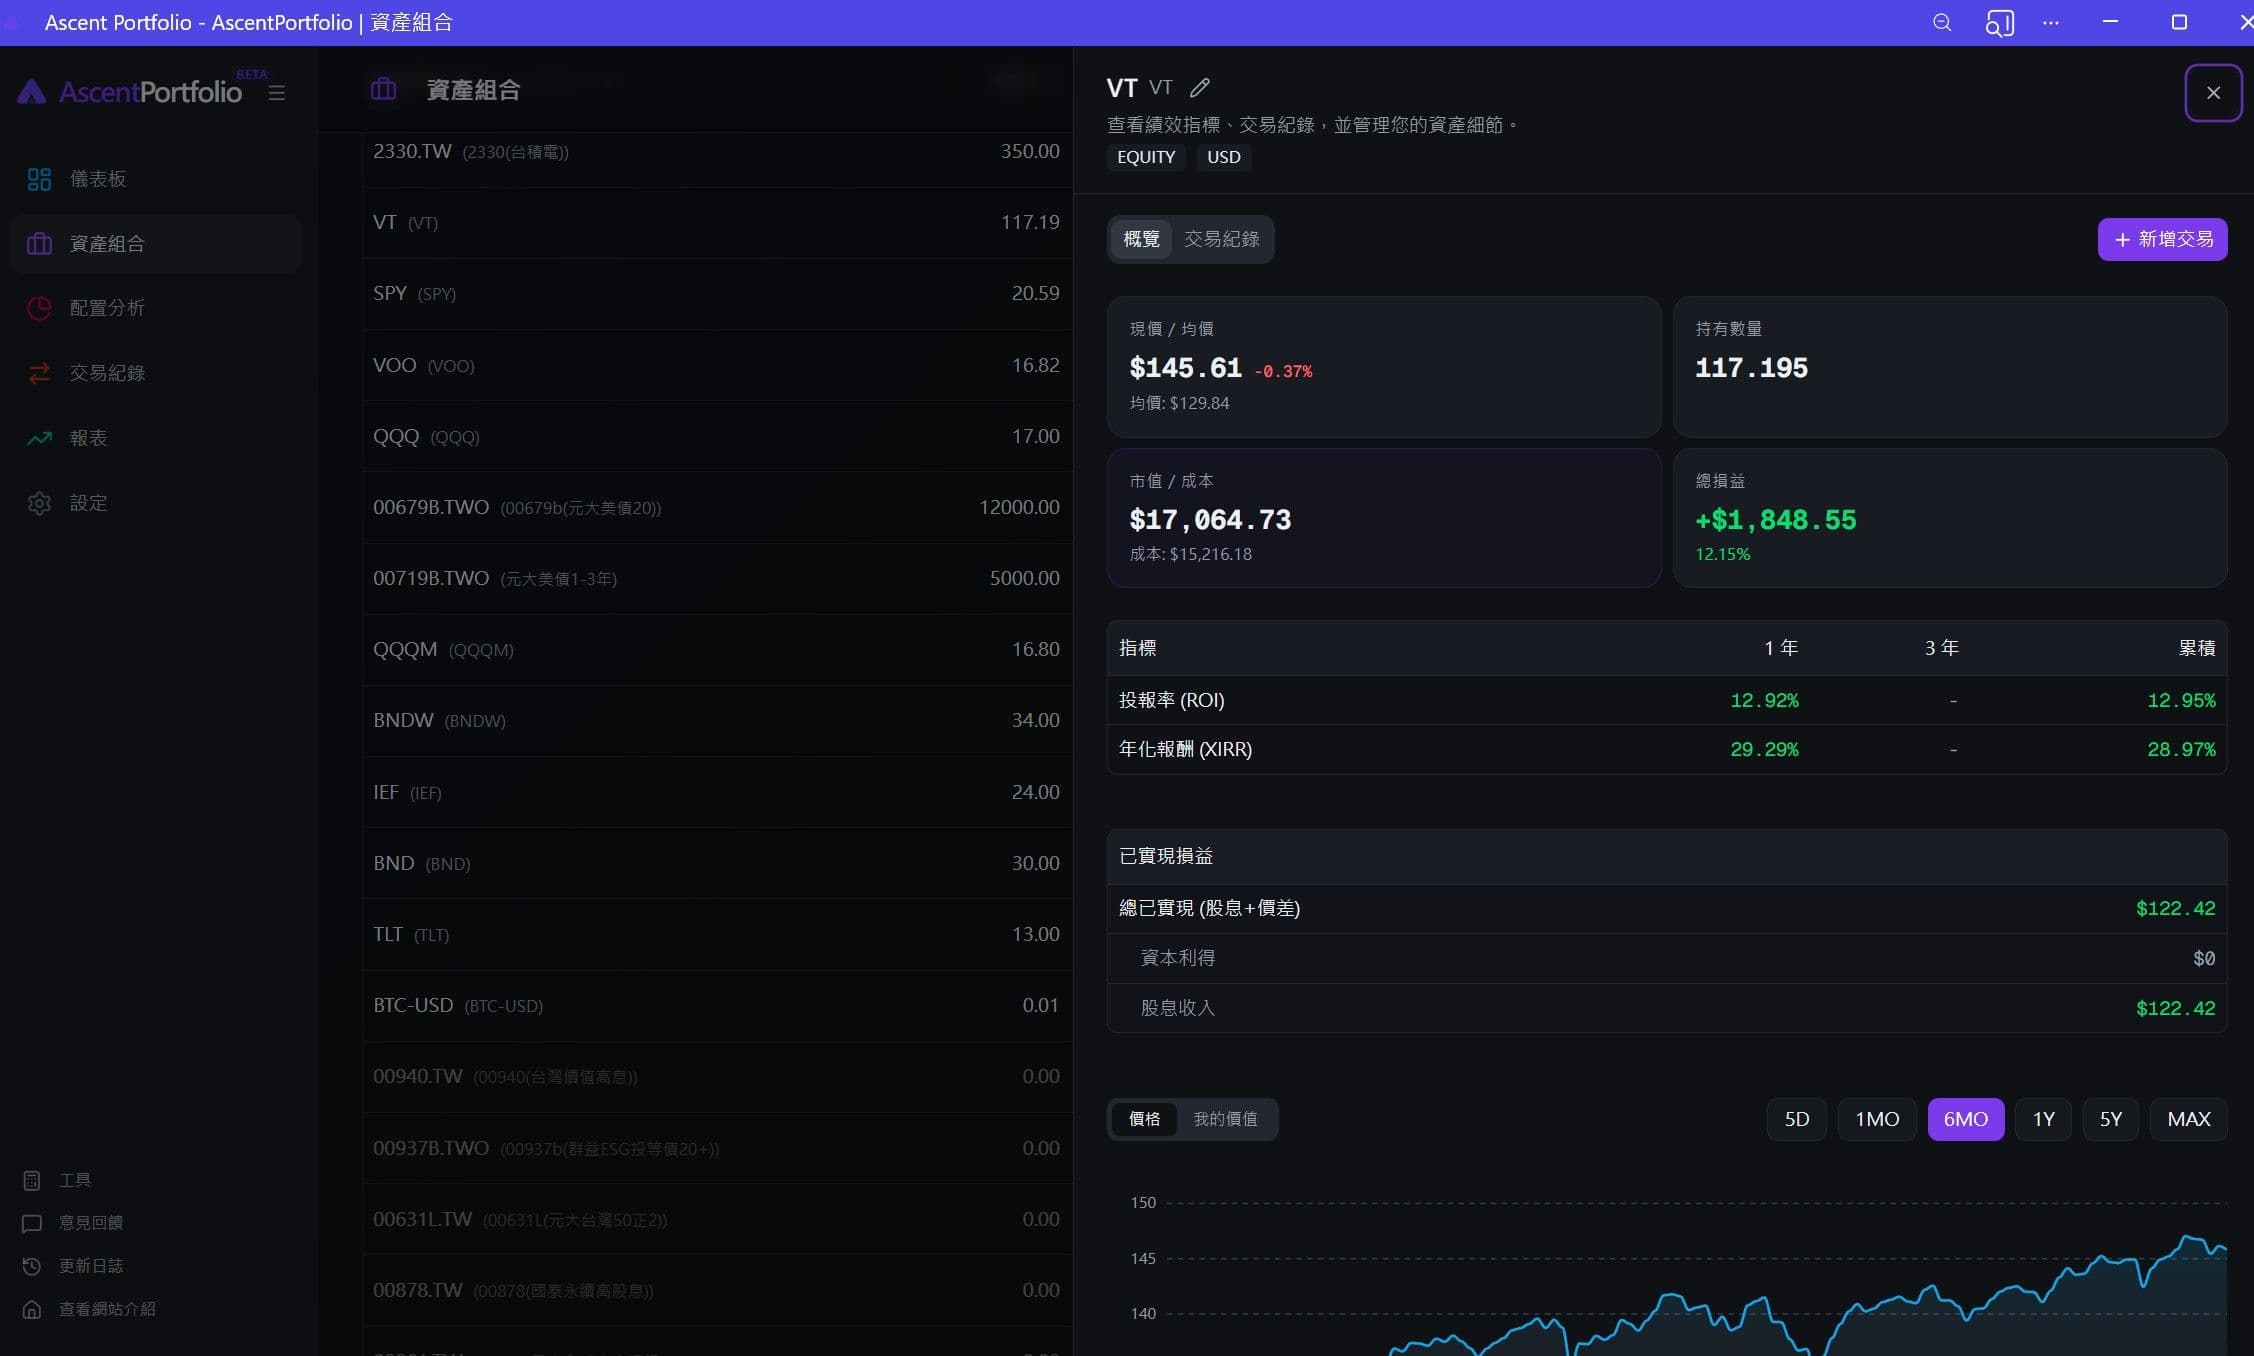
Desktop
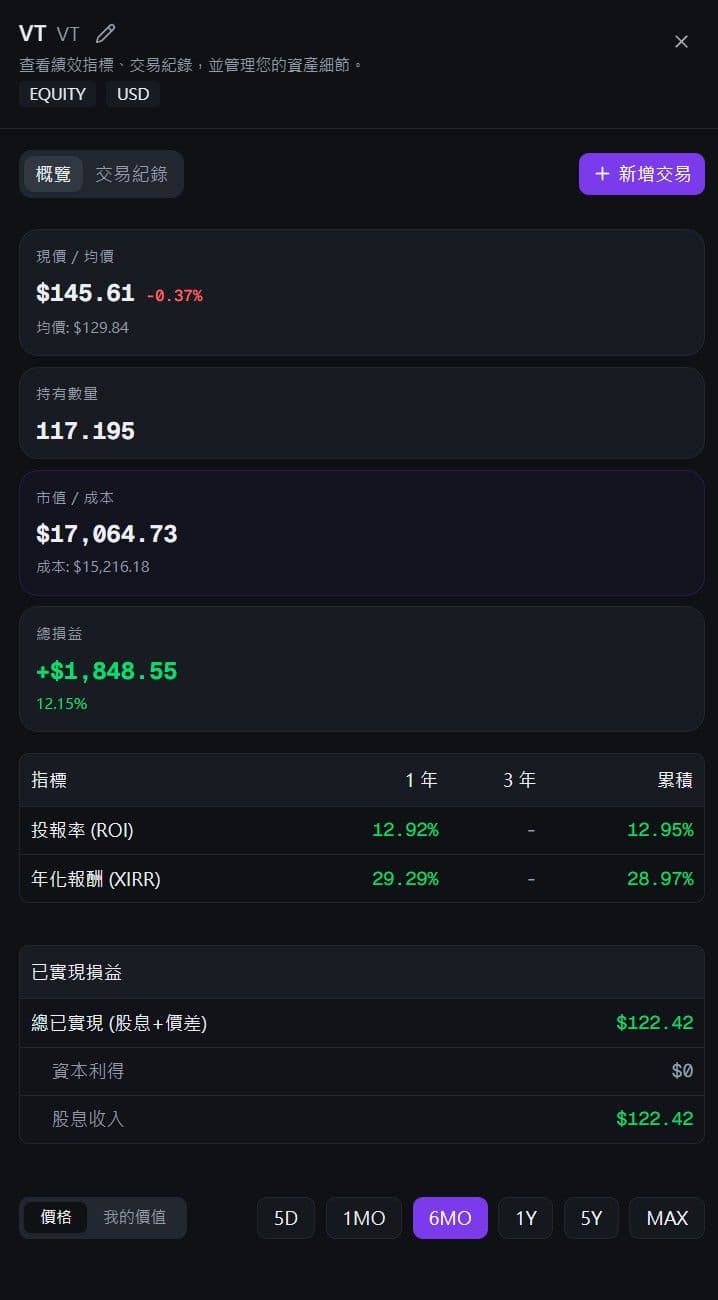
Mobile
Asset Allocation & Rebalancing
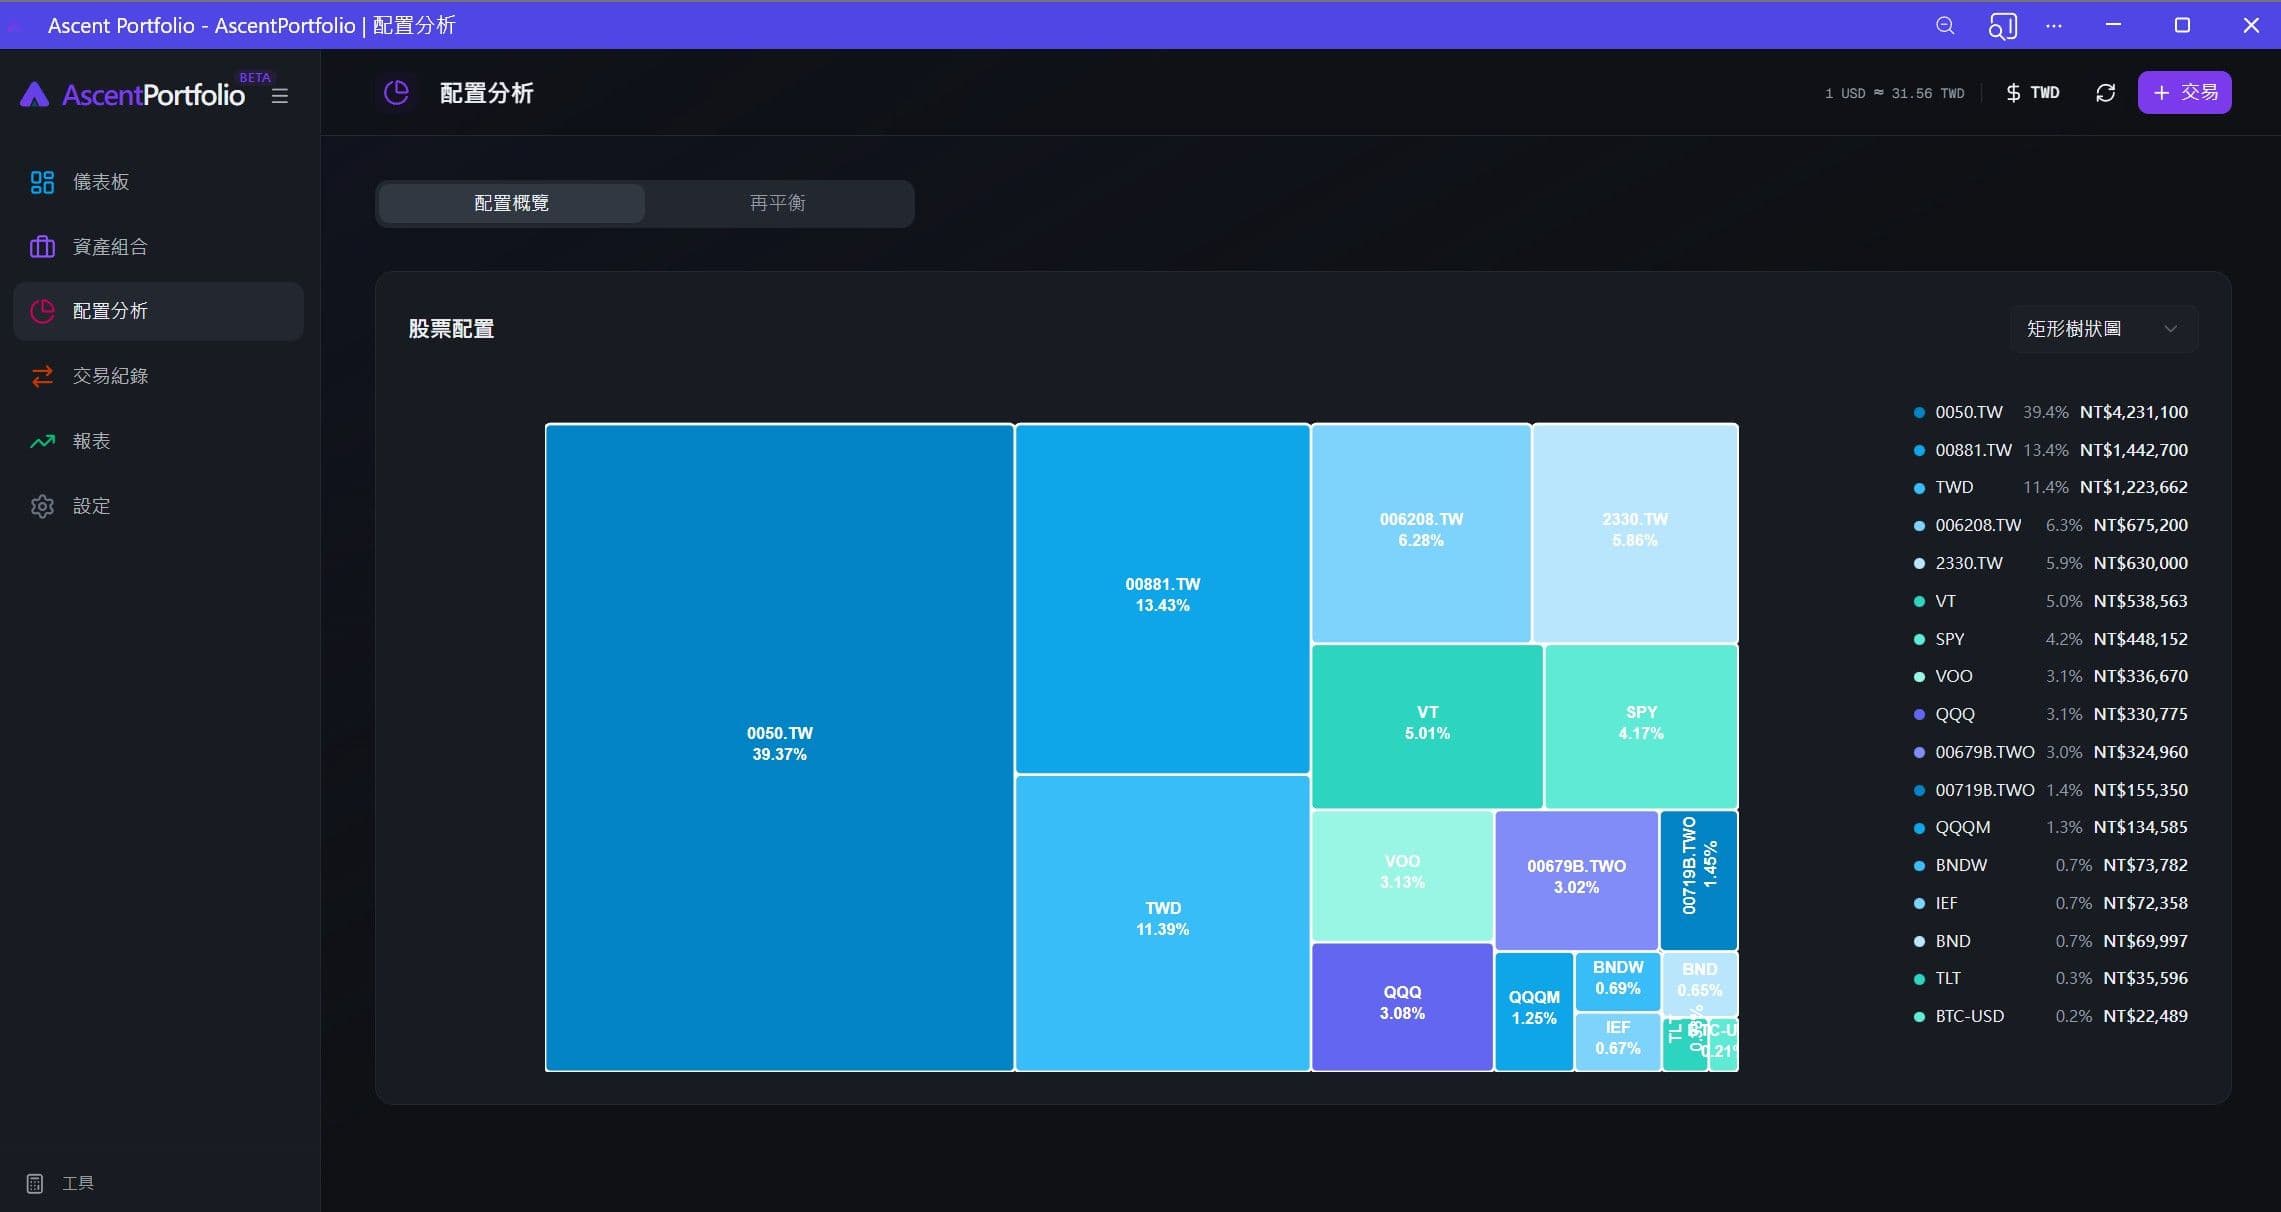
Desktop
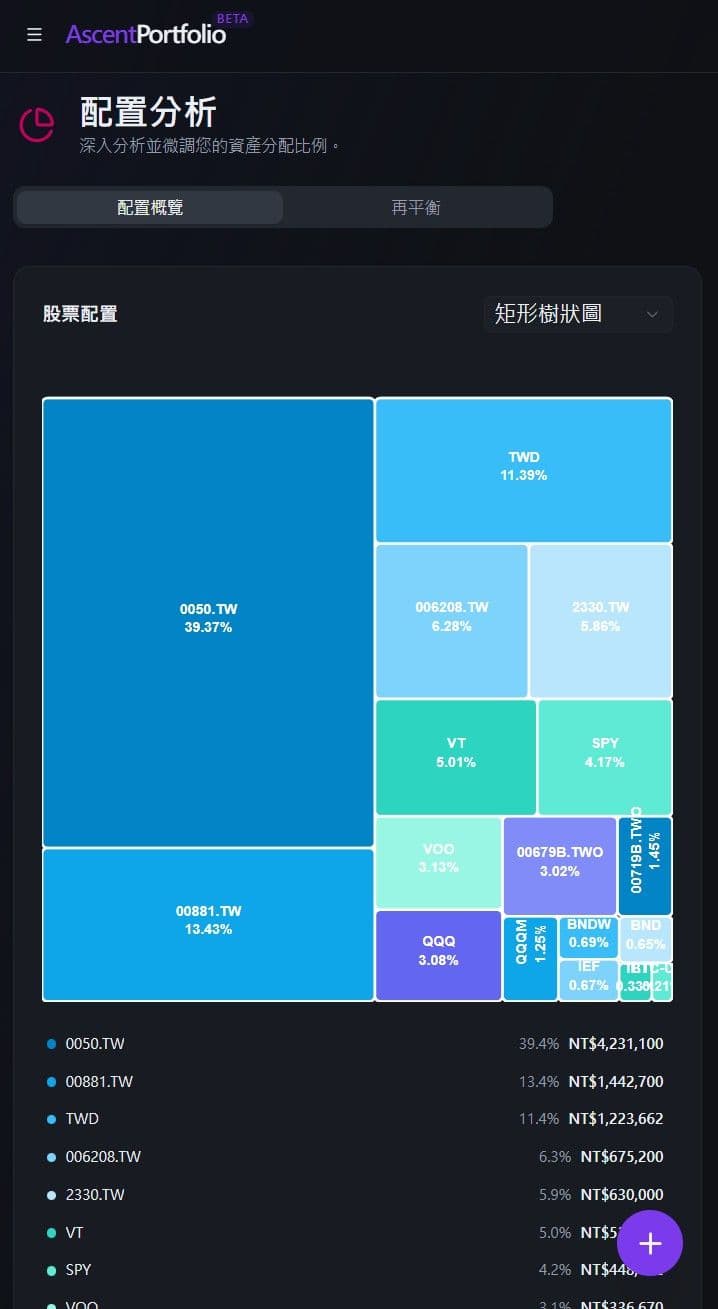
Mobile
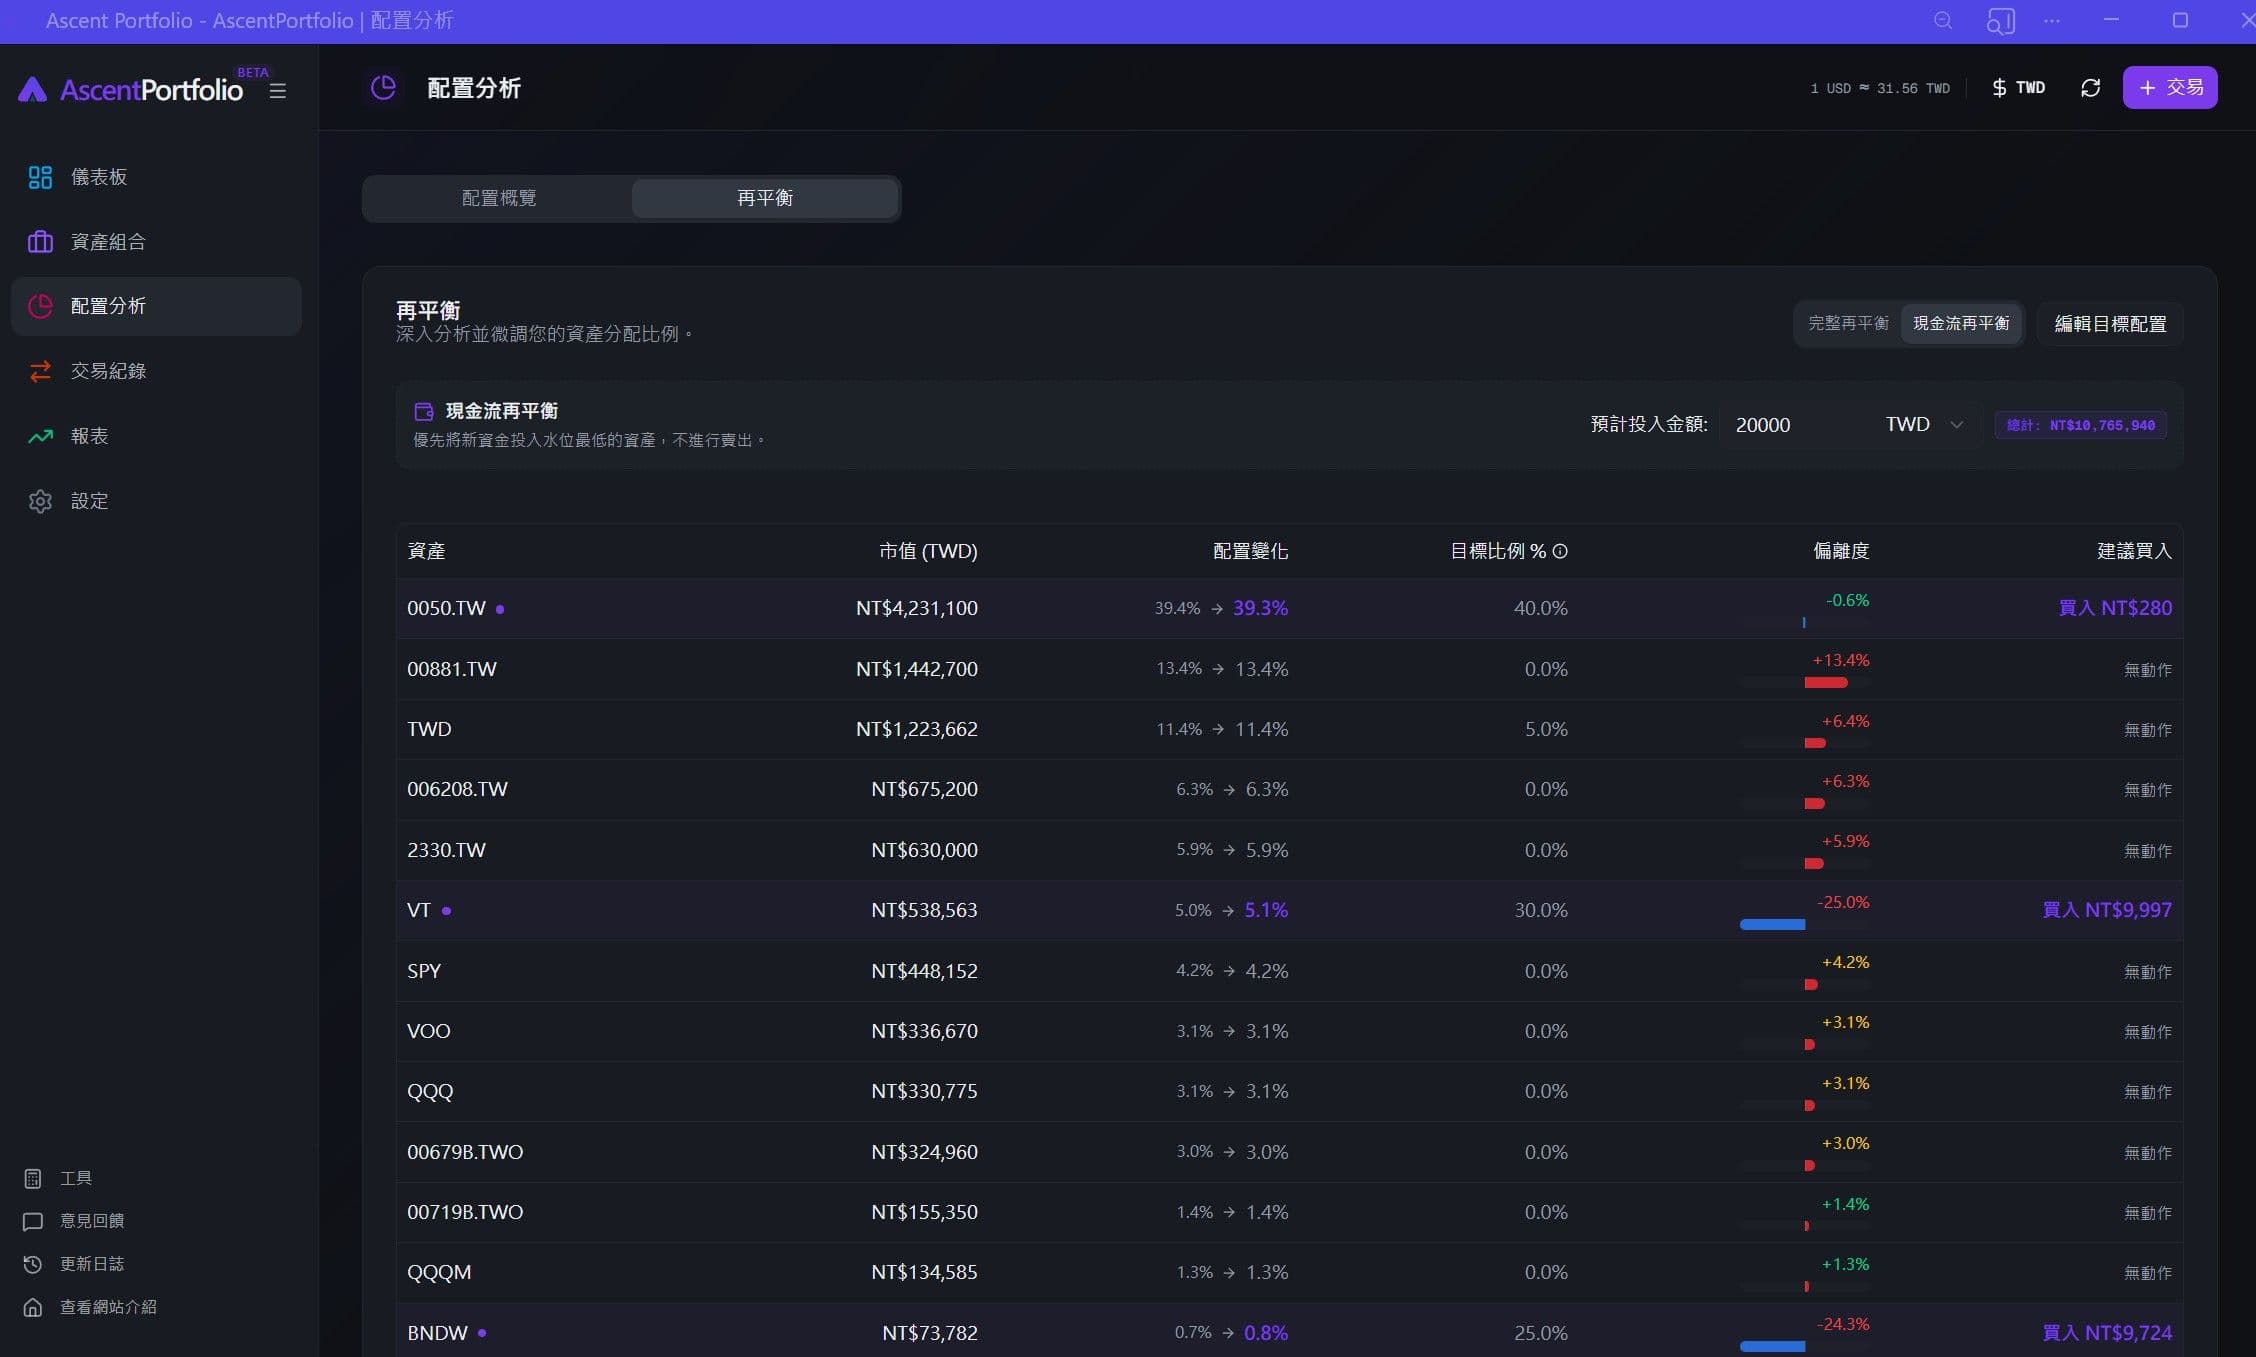
Rebalancing (Desktop)
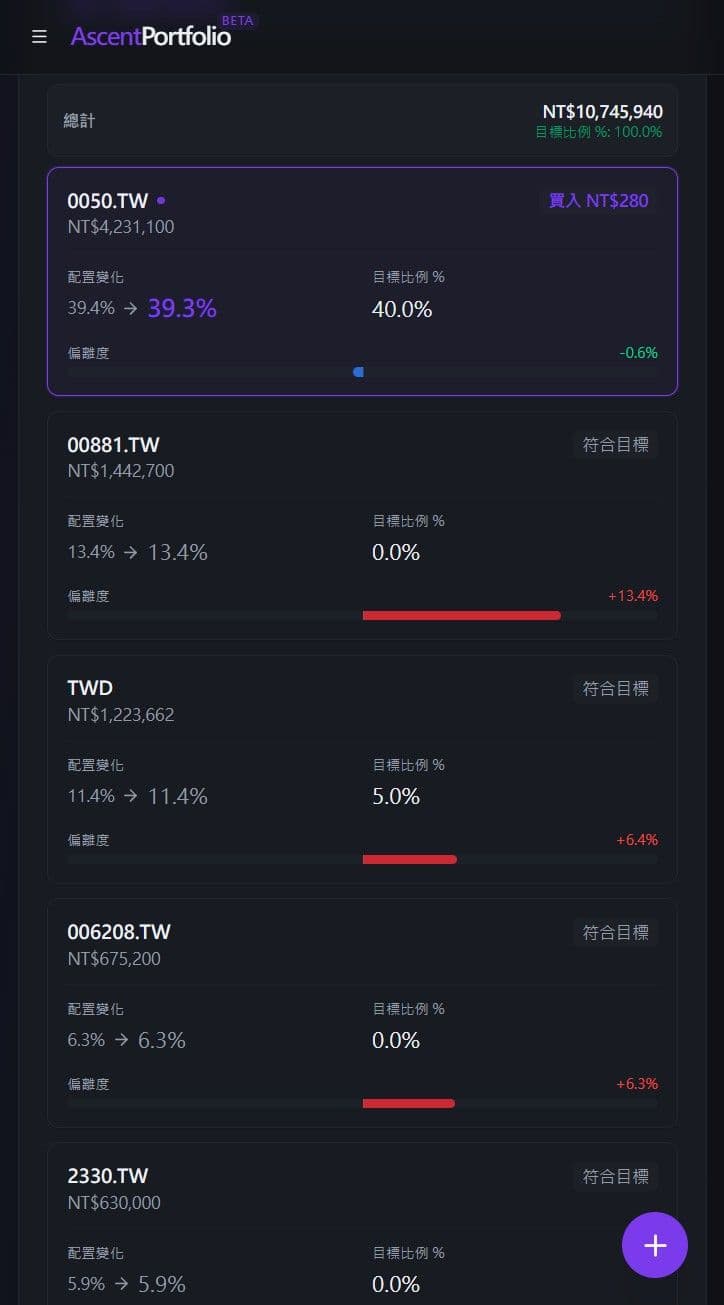
Rebalancing (Mobile)
- Allocation pie charts: View distribution by asset class or individual holdings.
- Target allocation settings: Define your ideal stock/bond ratio or asset weights.
- Drift monitoring: Visual comparison between actual and target allocations.
- Rebalancing calculator: Automatically suggests how many shares to buy or sell to get back on track.
Reports
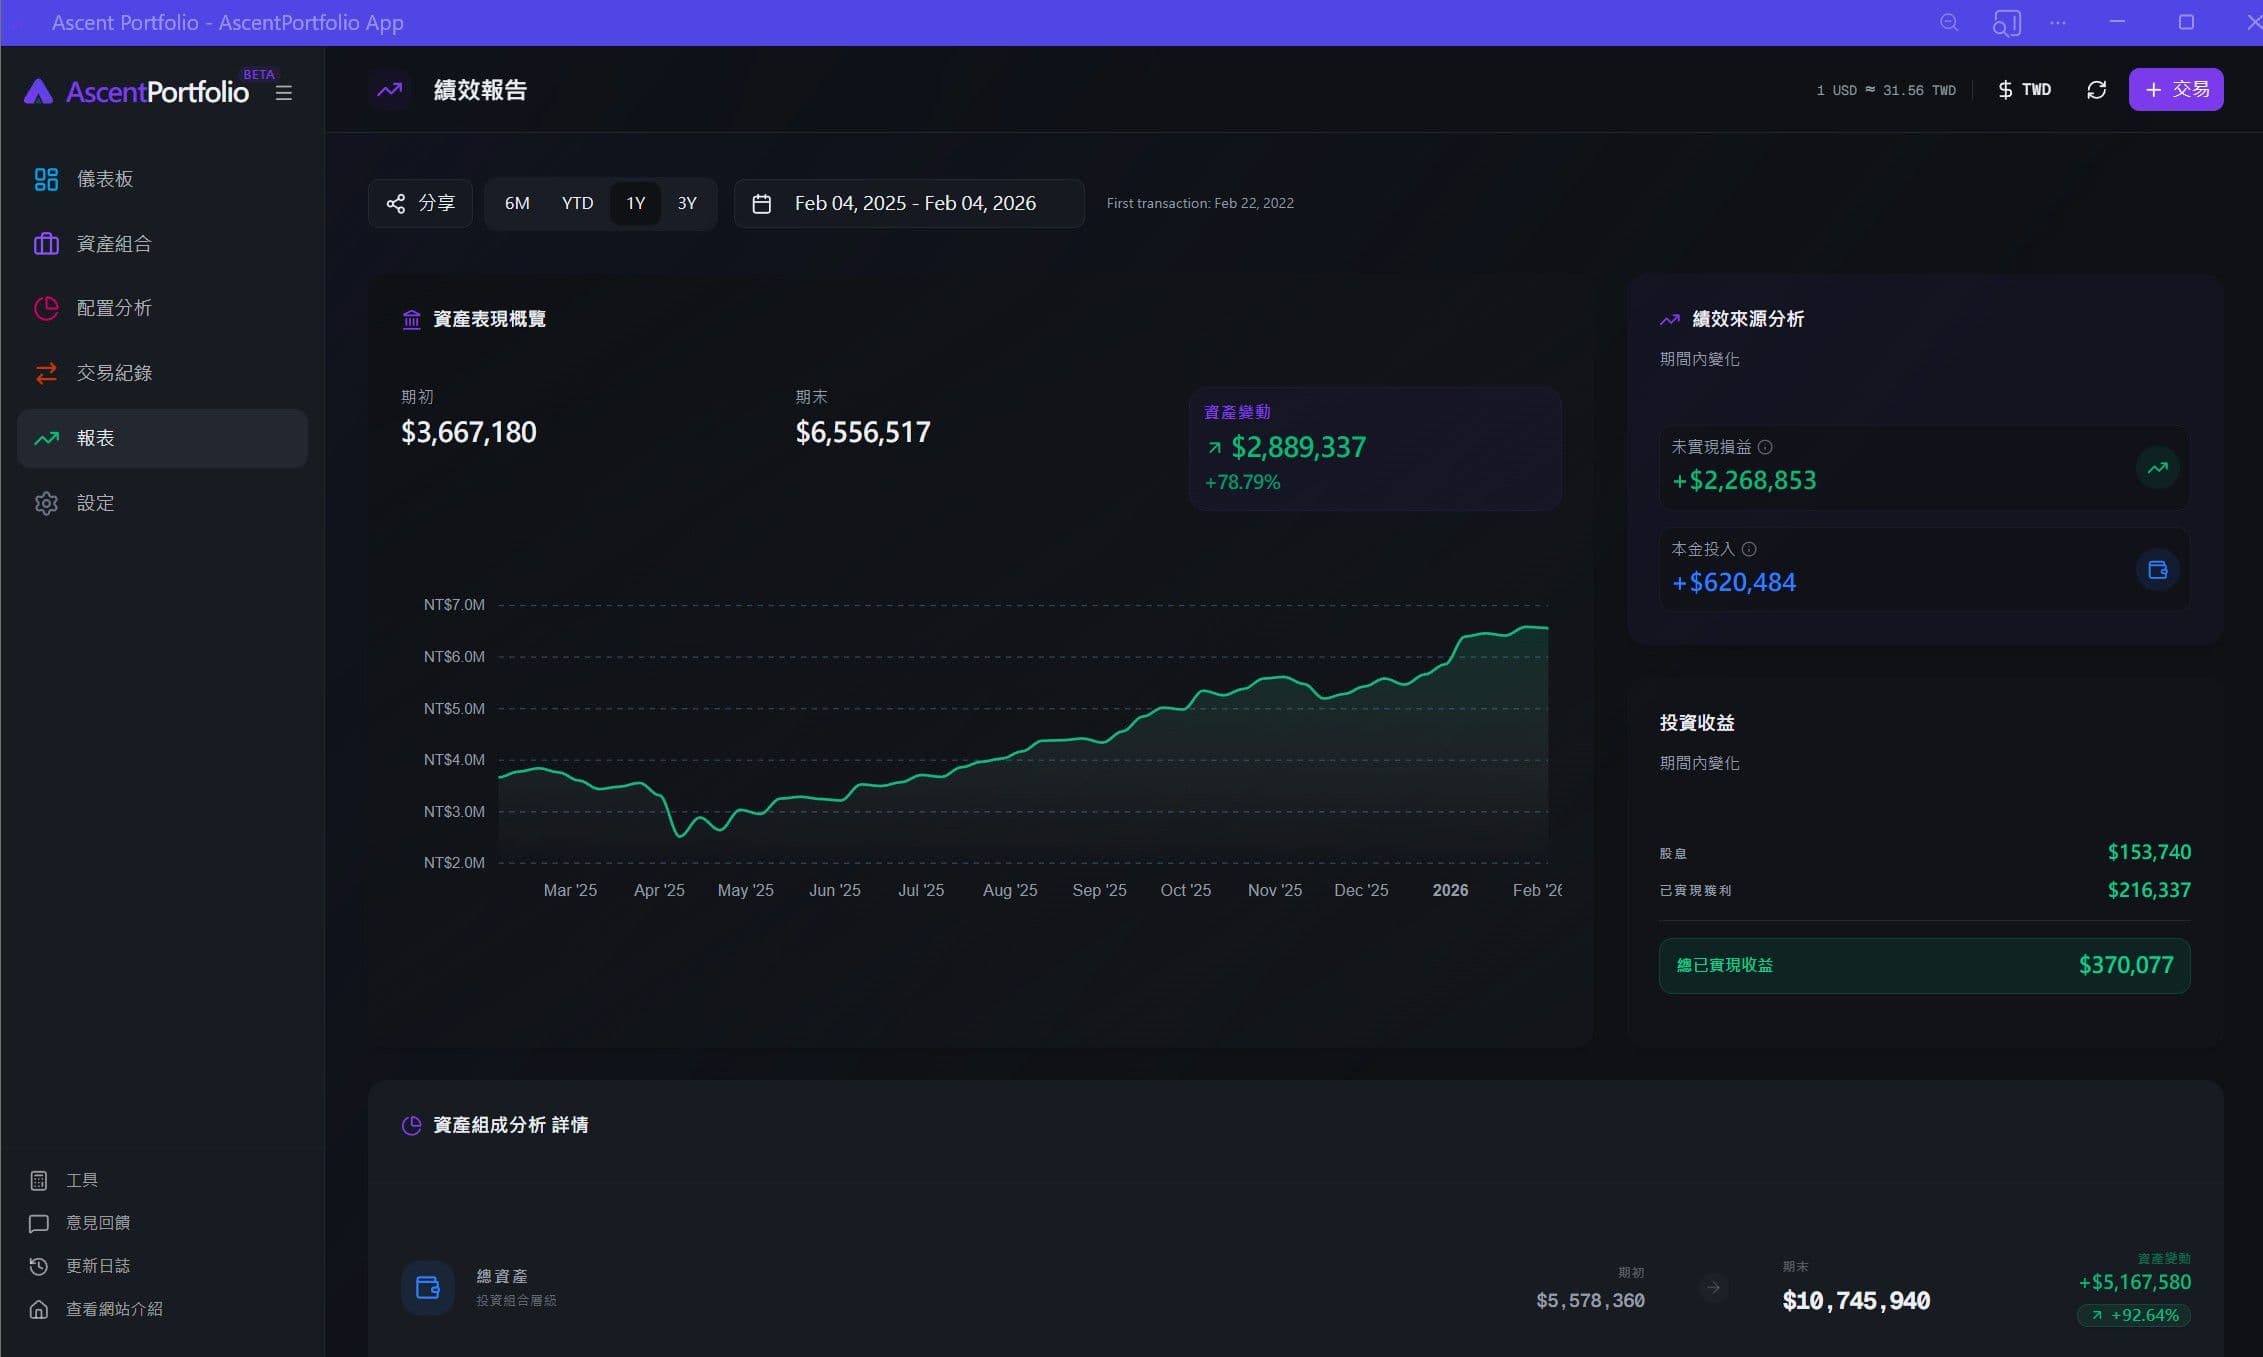
Desktop
Mobile
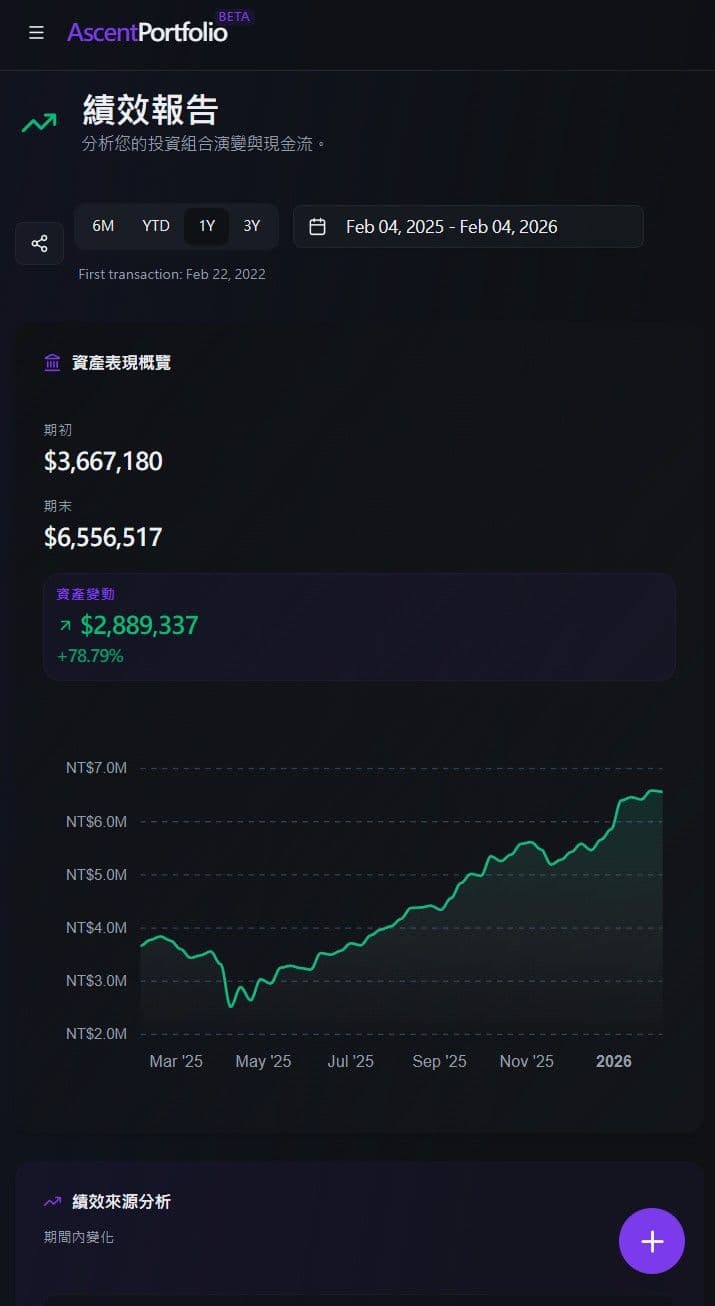
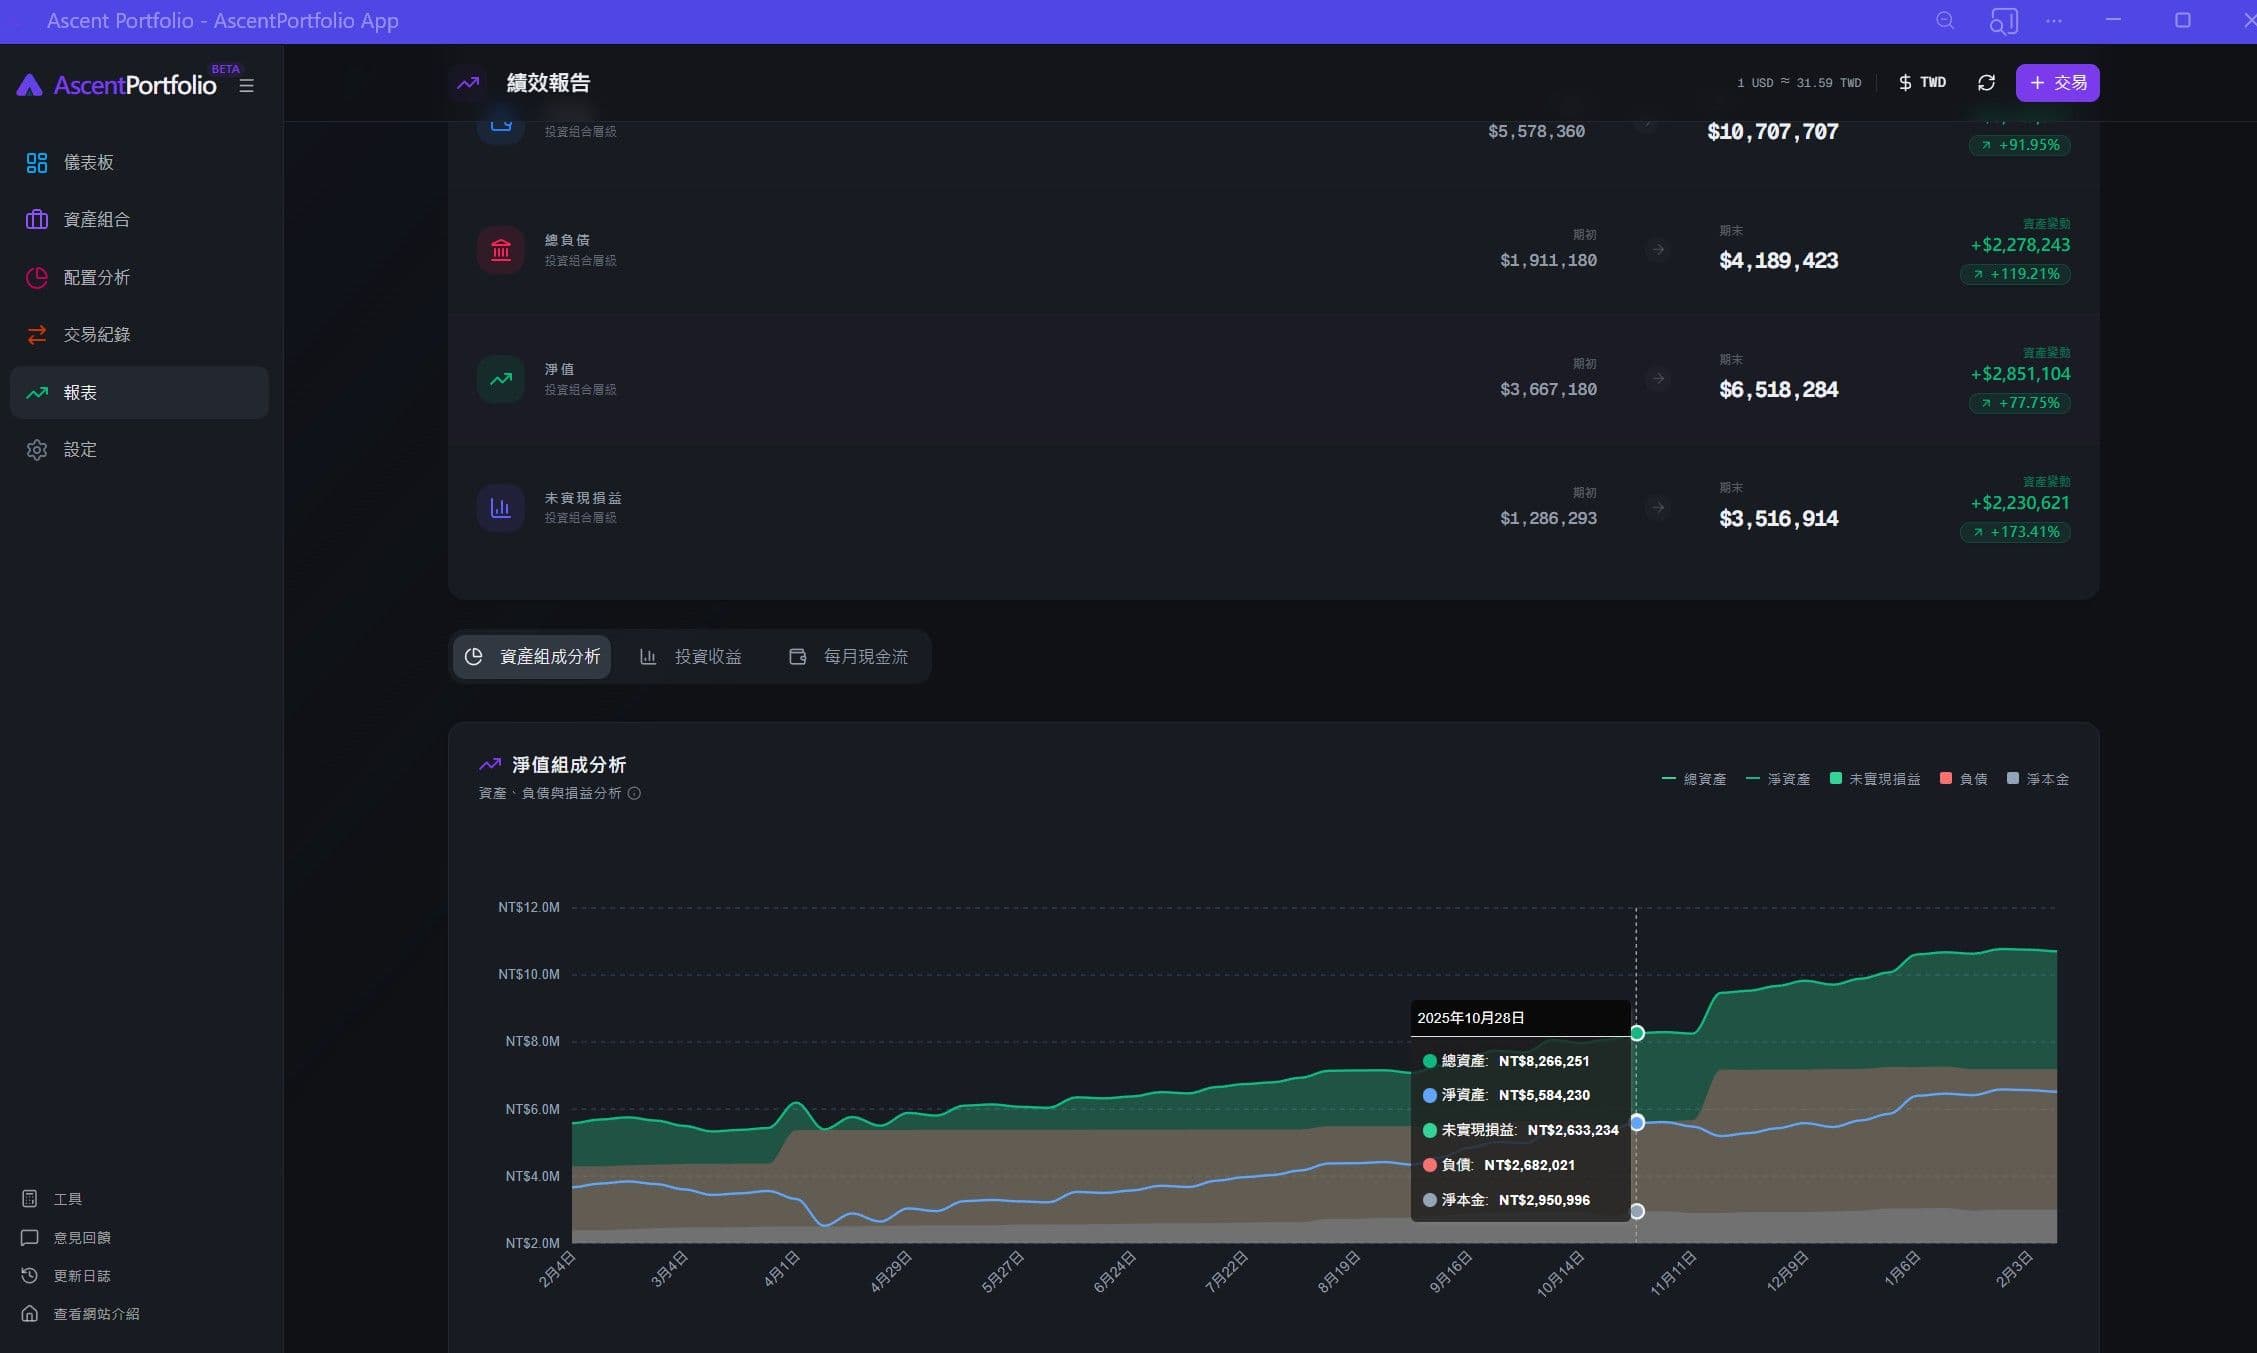
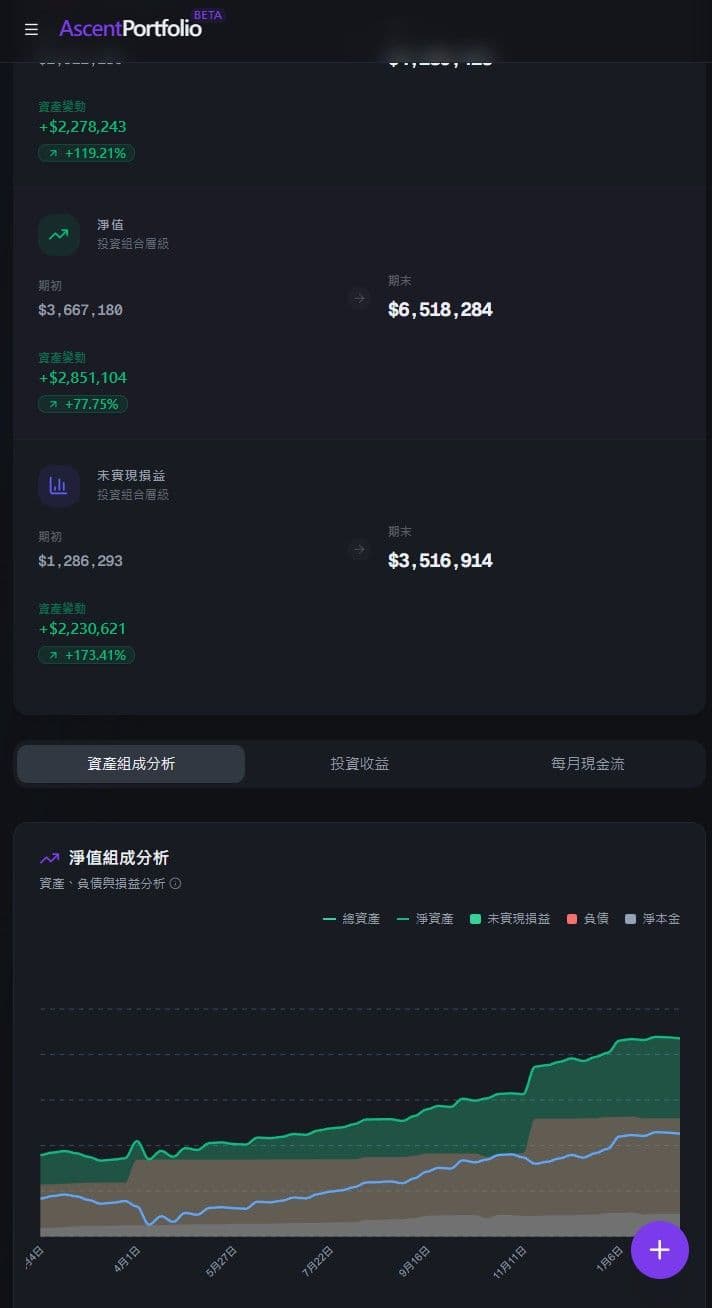
- Net worth growth chart: Historical portfolio value over time.
- Custom time ranges: YTD, last year, or any custom date range.
- Net worth change & Dividends summary & Realized P&L
Desktop
Mobile
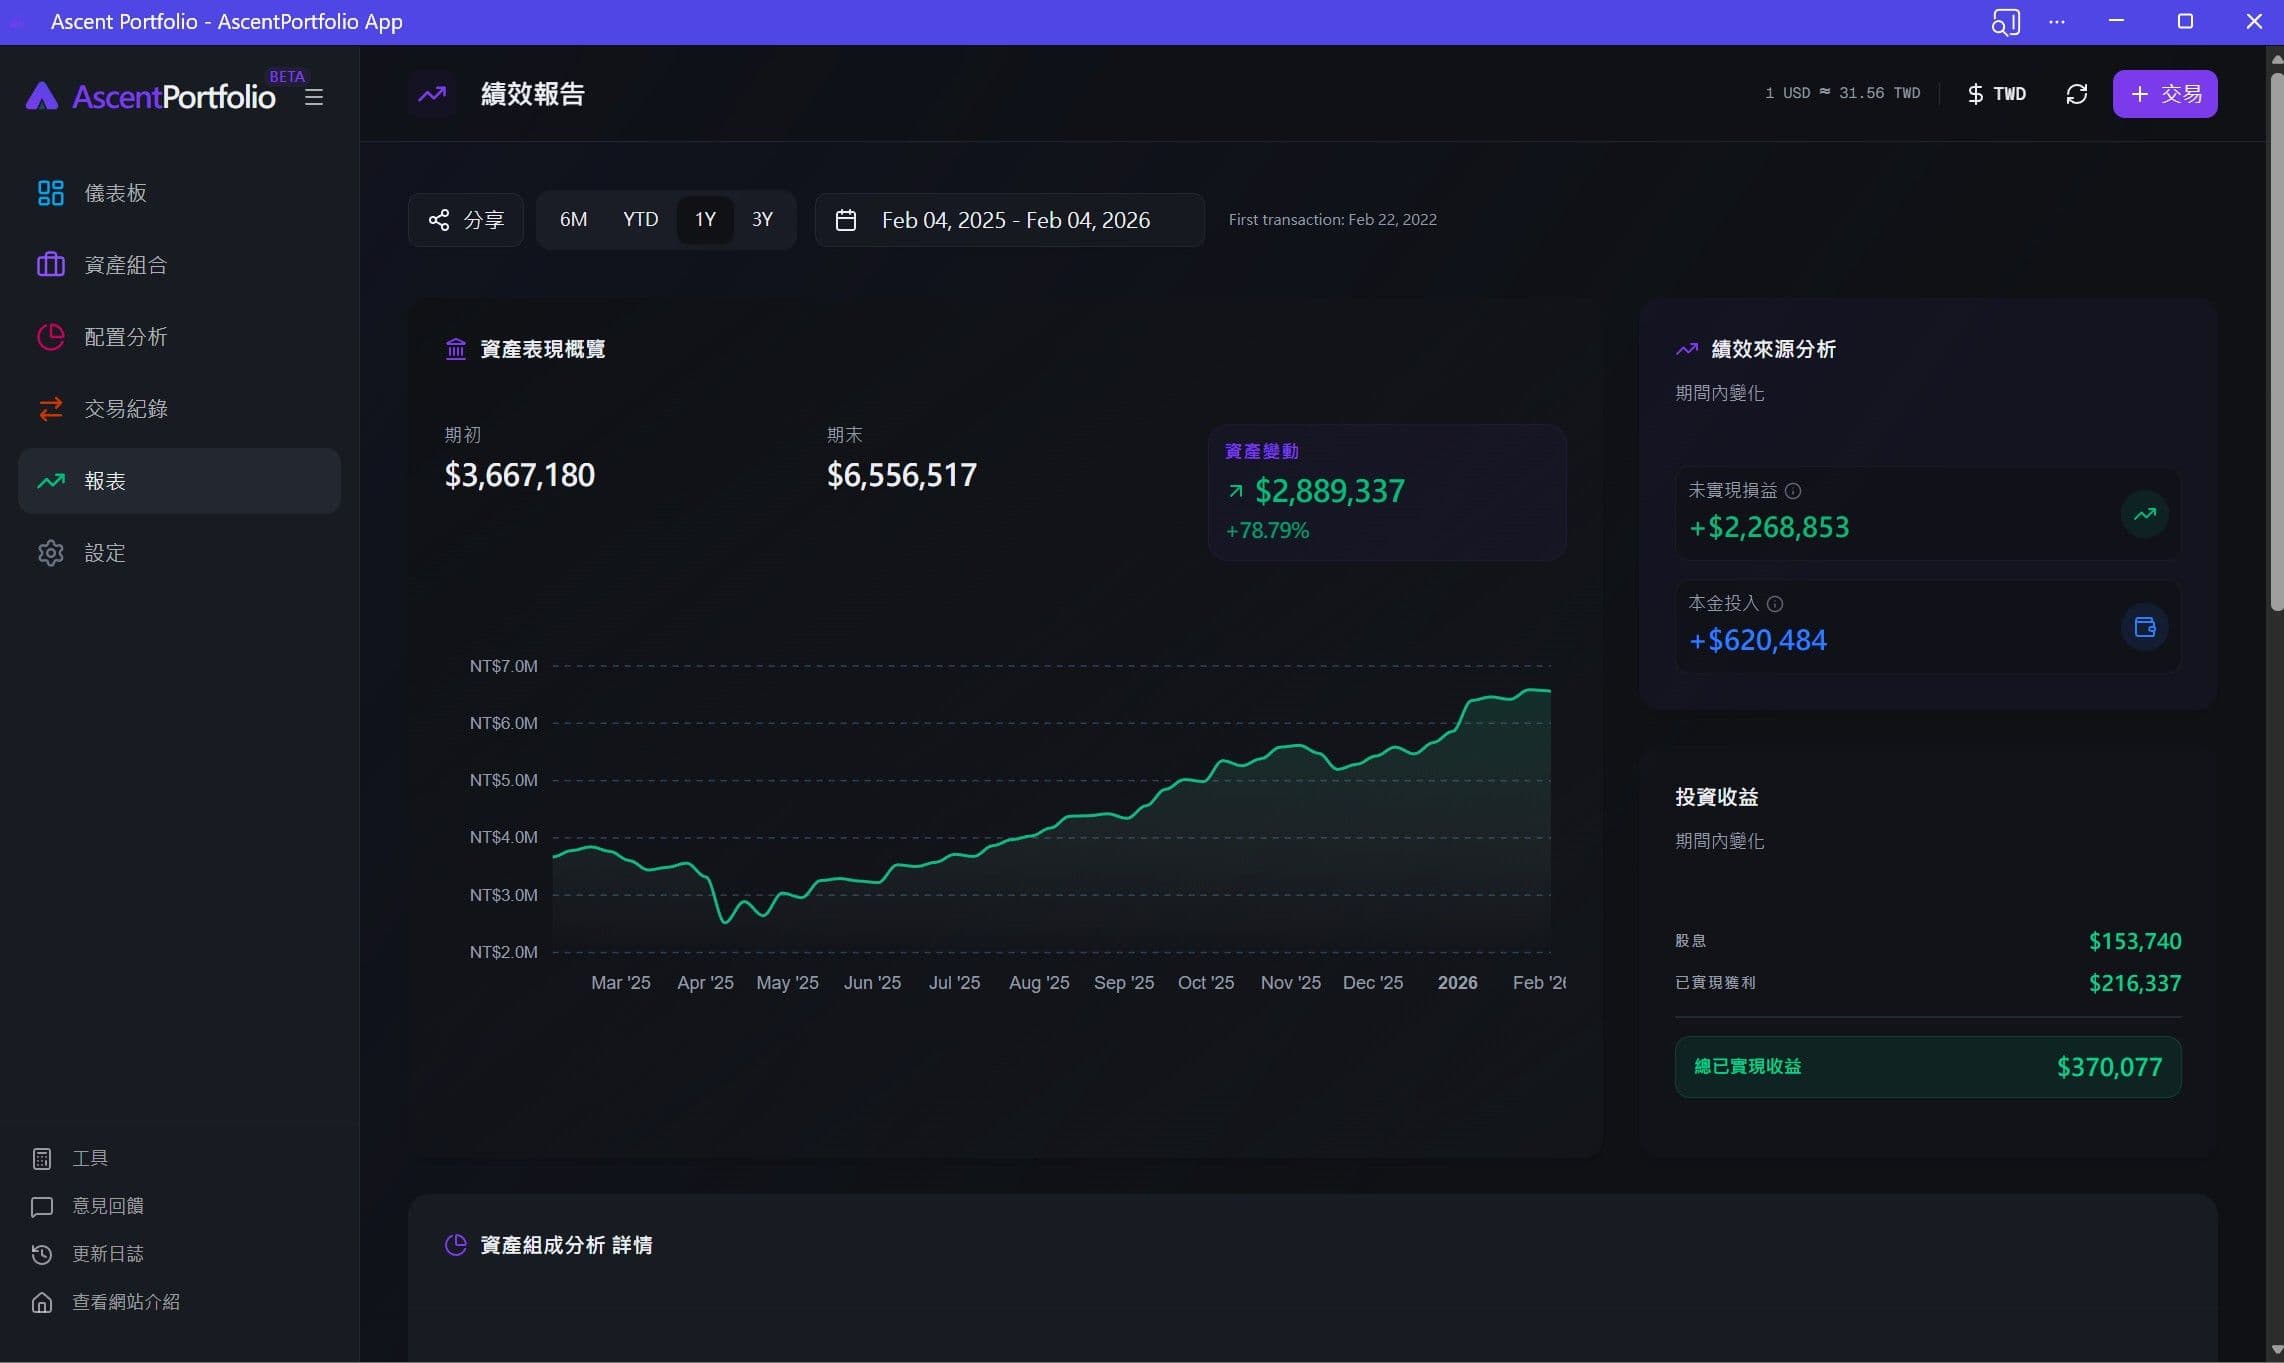
The net worth curve filters out daily market noise and shows what really matters — how your assets steadily climb over time. You can also clearly see the impact of capital contributions and leverage on your long-term growth.
Closing Thoughts: A Calm Tool Built with Vibe Coding
I built Ascent Portfolio because I believe the most valuable part of investing isn’t chasing quick wins — it’s watching your assets grow, slowly and consistently.
Index investing is a long climb. In the middle of daily market fluctuations, it’s easy to forget how far you’ve already come. Ascent Portfolio exists to record that journey — every step of the ascent.
When you look back at a curve named “Ascent” steadily rising over the years, that quiet sense of discipline and patience becoming visible is what helps you stay invested and keep going.
Ascent Portfolio is currently in Open Beta, and all core features are free to use. If you’re tired of maintaining Excel spreadsheets or looking for a cleaner, more focused tool for index investing, you’re welcome to try it out.